
Blog / Missing Middle Housing
How to Read the Colours on Toronto's Official Plan Land Use Map
Written by Anthony Palleschi · October 29, 2026 · 6 min read
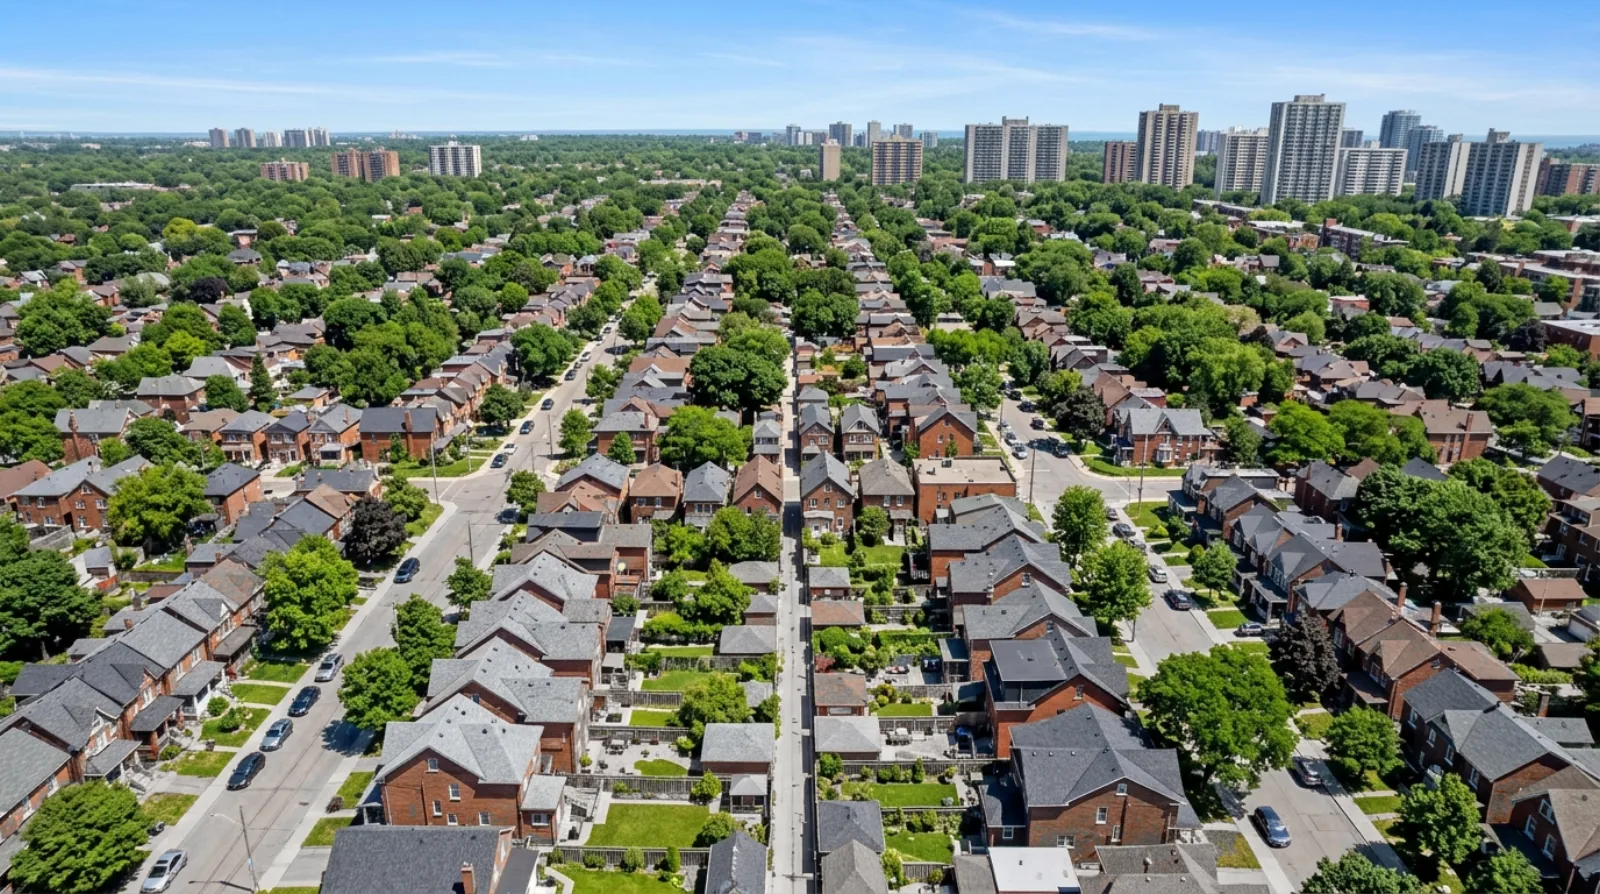
Toronto's Official Plan is the City's long-term plan for how land is used. Its land use maps give every part of the city a colour, and each colour is a land use designation. If you have heard that a house is "in the yellowbelt," that means its lot is coloured yellow on these maps. This post explains every colour and line on the map, using Map 15 and Chapter 4 of the Official Plan as they read on November 1, 2026.
I'm Anthony Palleschi, a real estate sales representative in Toronto, and I work with owners and builders on lots that could hold more than one home. For what your lot can hold once you know its colour, see the guides for sellers and developers.
Where to find the maps
The City's Official Plan Maps page, last changed June 19, 2026, has a section called "Maps 13-23 Land Use," with one PDF for each part of the city. The page says the maps "are current as of the June 2026 consolidation." If you do not know which map covers your street, its "Search by Map" tool lets you choose an area labelled A to K.
The eleven colours
Every land use map has the same legend on the right side. Here it is from Map 15, with a short description of each designation from Chapter 4 of the Official Plan:
| Colour | Designation | What Chapter 4 says it is |
|---|---|---|
| Yellow | Neighbourhoods | A full range of residential uses within lower scale buildings |
| Orange | Apartment Neighbourhoods | Areas where a greater scale of buildings is permitted than in Neighbourhoods |
| Red | Mixed Use Areas | A broad range of commercial, residential and institutional uses |
| Dark green | Natural Areas | Maintained primarily in a natural state |
| Bright green | Parks | Used primarily for public parks and recreation |
| Pale green | Other Open Space Areas | Used primarily for golf courses, cemeteries and public utilities |
| Blue | Institutional Areas | Major educational, health and governmental uses |
| Brown | Regeneration Areas | Areas opened to a wide array of uses to help attract investment |
| Light purple | General Employment Areas | Places for business and economic activities |
| Dark purple | Core Employment Areas | Places for business and economic activities |
| Grey | Utility Corridors | Hydro and rail corridors |
The legend also shows three kinds of line: a dotted line for hydro corridors, a dashed grey line for railway corridors, and white lines for streets.
How much of the map is yellow
The City's Neighbourhood Intensification Summary, published by City Planning in 2025, gives the size of the yellow area. Neighbourhoods cover 224.5 square kilometres, "just over 35% of the city's total land area and around 80% of the city's residential land area." The same summary says almost 1.5 million people lived in Neighbourhoods as of 2021. My earlier post, Toronto's Yellowbelt: Opportunities and Challenges, covers that background.
Other Official Plan maps to know
The land use maps are Maps 13 to 23. Two other kinds of map matter for the same lot:
- Map 3, "Right-of-Way Widths Associated with Existing Major Streets," shows the roads where the City's Major Streets rules allow townhouses and small apartment buildings on lots that face them.
- The maps of Secondary Plans, site and area specific policies and Special Policy Areas, which the Official Plan Maps page lists for each part of the city, add local policies on top of the colour.
Reading Map 15 as an example
Map 15 covers the south of Etobicoke, with Highway 427, Kipling Avenue, Islington Avenue, Royal York Road and Park Lawn Road marked. Most of the land between the main roads is yellow. Red strips of Mixed Use Areas run along several of the main roads. Large purple Employment Areas sit in the middle of the map near the Gardiner Expressway, and green parks and natural areas follow the lake and the river valleys. A few orange blocks mark Apartment Neighbourhoods.
A house on a side street inside the yellow is in a Neighbourhoods area. A house inside one of the red strips is in a Mixed Use Area, even if it is a house today. The colour shows the planned use of the land, which can differ from what stands on it now.
Tips for reading your own lot
This section is my own advice from reading these maps.
- Zoom in on the PDF. The maps are drawn at a city scale, and a single lot is small.
- Find your street by the white street lines and the main road names, then find your lot's position along it.
- If your lot sits on the edge between two colours, do not guess. Check your zone label on the City's Zoning By-law Interactive Map and ask City Planning.
- Read the note at the top of the legend. Map 15 says it "includes known in-effect Official Plan Amendments (OPAs) up to OPA878." A later amendment may not be on it yet.
- Check whether a Secondary Plan or a site and area specific policy covers your street. The Official Plan Maps page lists those maps for each area, and they can add rules to the colour.
What the colour tells you, and what it leaves out
The colour gives the broad planned use. The zoning by-law sets the detailed rules for each lot: how many units, how tall, how far from the lot lines. A yellow lot in a residential zone is where the City's multiplex, garden suite and laneway suite rules mostly apply. A yellow lot that faces a Major Street, a road shown on Map 3 of the Official Plan, can also hold townhouses or a small apartment building under the Major Streets rules.
For an owner, the colour is the first step in working out what a builder might see in your lot. For a builder, it is the first filter when looking for sites. In both cases, the zone label comes next.
Questions to ask about your lot
- What colour is my lot on the land use map for my area?
- Is my lot on the edge between two colours?
- Does a Secondary Plan or a site and area specific policy cover my street?
- What zone label does my lot carry on the Zoning By-law Interactive Map?
- Does my lot face a road on Map 3?
If you have found your lot's colour and want to know what it means for a sale or a build, see how I work with sellers, or reach me through the contact page or at 416-636-6800.
Planning and development potential is property-specific and subject to zoning, approvals, site conditions, municipal review and other due diligence.
Sources
All pages opened on November 1, 2026 (PT).
- City of Toronto, Official Plan Maps page (date modified June 19, 2026): Maps 13 to 23, the June 2026 consolidation and the Search by Map tool.
- City of Toronto, Official Plan Map 15, Land Use Plan (published June 2026): the legend, the colours, the lines and the amendments included up to OPA 878.
- City of Toronto, Official Plan Chapter 4 (date modified June 17, 2026): the description of each land use designation.
- City of Toronto, Zoning By-law Interactive Map: zone labels by address.
- City of Toronto, Neighbourhood Intensification Summary (2025): the size of the Neighbourhoods area and its 2021 population.
Frequently asked questions
What does yellow mean on Toronto's Official Plan map?
Yellow on Toronto's Official Plan land use maps marks Neighbourhoods. Chapter 4 of the Official Plan says Toronto's Neighbourhoods contain a full range of residential uses within lower scale buildings. This yellow land is what people call the yellowbelt, and it is where the City's multiplex, garden suite and laneway suite rules mostly apply.
What does orange mean on Toronto's Official Plan map?
Orange on Toronto's Official Plan land use maps marks Apartment Neighbourhoods. Chapter 4 of the Official Plan says Apartment Neighbourhoods are distinguished from low-rise Neighbourhoods because a greater scale of buildings is permitted. On Map 15, for example, a few orange blocks sit among the yellow Neighbourhoods.
What does red mean on Toronto's Official Plan map?
Red on Toronto's Official Plan land use maps marks Mixed Use Areas. Chapter 4 of the Official Plan describes Mixed Use Areas as a broad range of commercial, residential and institutional uses. On Map 15, for example, they appear as red strips along several main roads, next to the yellow Neighbourhoods behind them.
What do the green colours mean on Toronto's land use map?
Toronto's Official Plan land use maps use three greens. Dark green marks Natural Areas, kept mainly in a natural state. A brighter green marks Parks, used mainly for public parks and recreation. Pale green marks Other Open Space Areas, used mainly for golf courses, cemeteries and public utilities, according to the map legend and Chapter 4.
What do the purple areas mean on Toronto's Official Plan map?
Purple on Toronto's Official Plan land use maps marks Employment Areas. Light purple is General Employment Areas and dark purple is Core Employment Areas. Chapter 4 of the Official Plan describes Employment Areas as places of business and economic activities vital to Toronto's economy and future economic prospects. On Map 15, large purple areas sit near the Gardiner Expressway.
Where can I find Toronto's Official Plan land use maps?
The City of Toronto's Official Plan Maps page has a section called Maps 13-23 Land Use, with one PDF for each part of the city. The page says the maps are current as of the June 2026 consolidation. It also has a Search by Map tool with areas labelled A to K to find the right map.
Is the Official Plan colour the same as my zoning?
The Official Plan colour and the zone label are two separate City documents. The colour shows the land use designation, such as Neighbourhoods. The zone label in Zoning By-law 569-2013, shown on the City's Zoning By-law Interactive Map, sets the detailed rules for each lot, such as units, height and setbacks. Check both for your lot.
Why might my Official Plan map be out of date?
Each Toronto land use map lists the Official Plan Amendments it includes. Map 15, published June 2026, says it includes known in-effect amendments up to OPA 878. An amendment that came into effect later, or a site and area specific policy for your street, may change the picture. Ask City Planning about recent changes.